
HomeworkHelpOnline.net Blog
We have accumulated huge amount of experience and we are sharing it with you in the form of tutorials for your best learning experience.
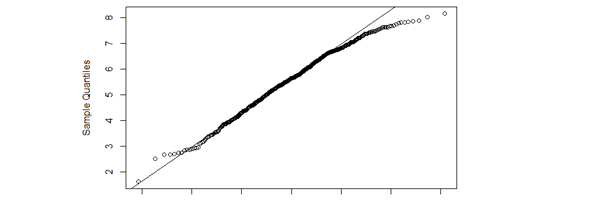
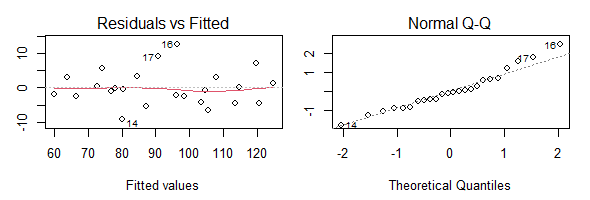
Linear Regression Example: Education Expenditure to Predict SAT
Example solution of analysis how SAT scores are dependent on Education expenditure. Model is built using linear regression. It explains 82% of variance in SAT scores.
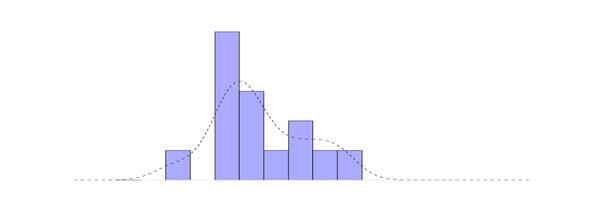
Data Preprocessing in R Studio: Example Solutions
Data preprocessing is the first step in a data modeling assignment. Learn the best practices following the solution to an example assignment. Topics covered: reading file, dealing with missing values, various plots, analyzing relations and distributions of the data.
Logistic Regression in R: Exercises and Solutions
Logistic Regression in R: Exercises and Solutions
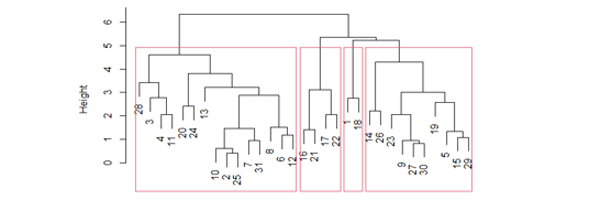
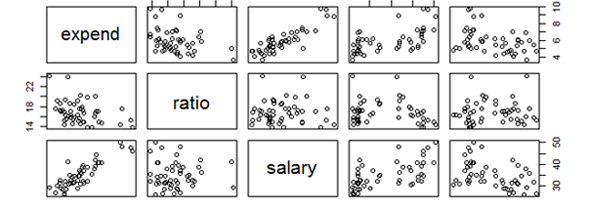
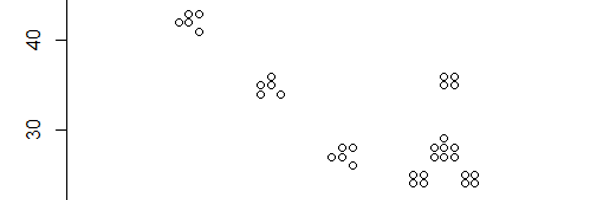
Factor Analysis, Clustering, Hypothesis Testing in R Studio
Factor Analysis, Clustering, Hypothesis Testing, Linear Regression: Exercises and Solutions in R.
Random Numbers and Game of Life in R Studio
The following exercises and solutions are from the book “Introduction to scientific programming and simulation using R” by O. Jones, R. Maillardet and A. Robinson (2009).
R Beginner Exercises And Solutions
Some introductory examples of reading csv, dealing with missing values, plotting histograms and a box plot.
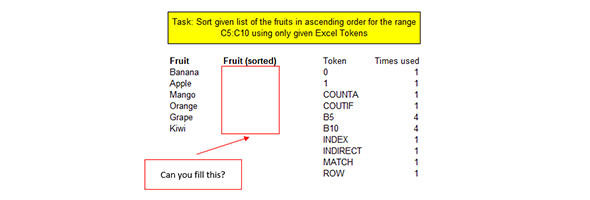
Excel Puzzle - Use Array Formula for Alphabetic Sort
This Excel task is really addicting and you definitely cannot go to sleep without finishing it - because you are an Excel Pro, right? :)
Kernel Density Estimation: Predict KDE & Generate Data
For a given data set X, predict its density function. Using the found density function generate new random data set Y and check the hypothesis that X and Y distributions are identical.
Tutorial: Kernel Density Estimation Explained
Quick bottom-up explanation of kernel density estimation with simple Python code. Get idea of what it's made of in a short 5 min read.
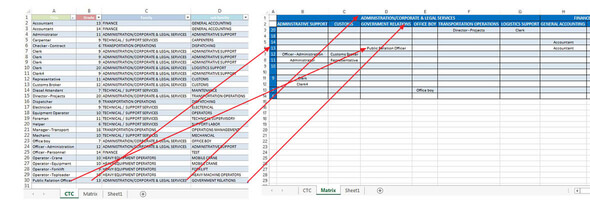
Excel Pivot Tables: Text Instead of Counts - VBA Method
Sometimes there is a need for using Pivot table to display data as a categorical table. This is a bit complicated, but working way to do it.
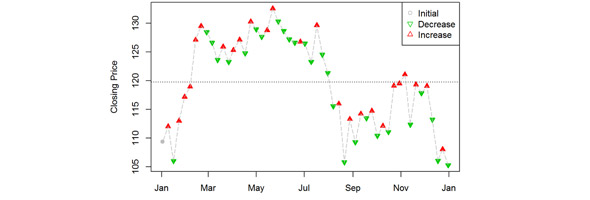
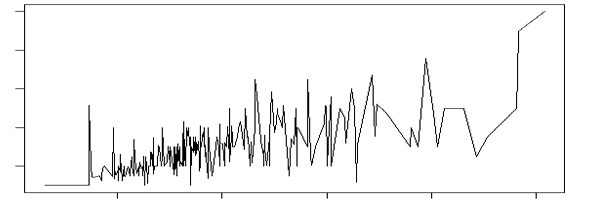
Base R Plot Series (Part = 1): Line Graph
We begin our plot series with a plot of Apple (AAPL) weekly stock prices for 2015 using simple Base R, no ggplot, no ggplot2.
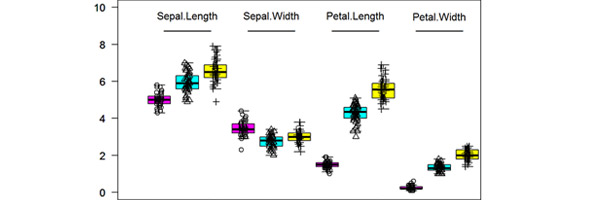
Base R Plot Series (Part = 2): Boxplot
Generate a nice boxplot using Base R and a standard Iris dataset.