Base R Plot Series (Part = 2): Boxplot
We introduce a "back to basics" series of R plots using only base R - no ggplot, no ggplot2. Other parts of the series:
Task: Fancy looking boxplots of Iris dataset
Method: R Studio, Base R
Dataset: Iris (in-built)
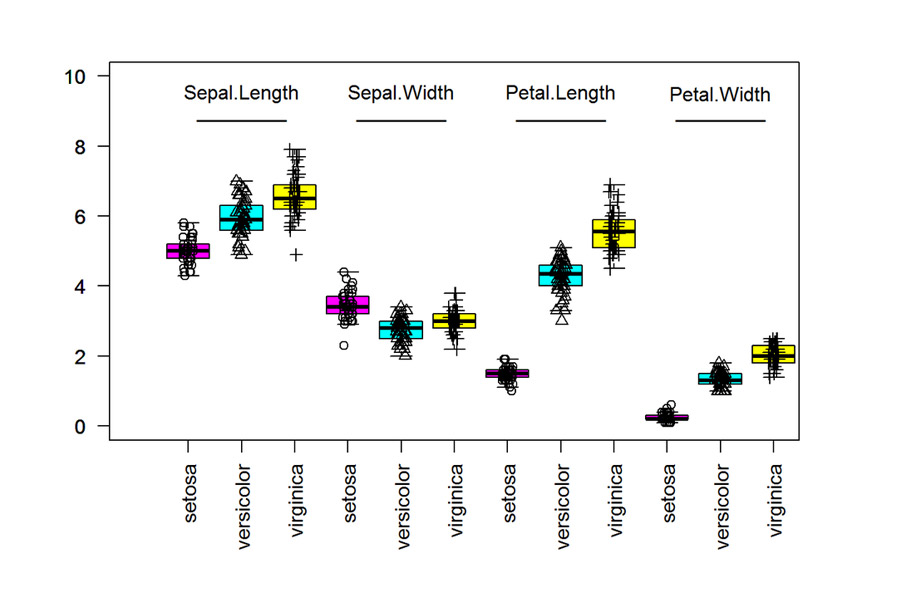
Code & Result
data(iris)
# create boxplots
boxplot(Sepal.Length ~ Species, data = iris, ylim = c(0, 10), xlim = c(0, 12), at = 1:3, outline = FALSE, col = c(6, 5, 7), las = 2)
boxplot(Sepal.Width ~ Species, data = iris, at = 4:6, add = TRUE, outline = FALSE, col = c(6, 5, 7), las = 2)
boxplot(Petal.Length ~ Species, data = iris, at = 7:9, add = TRUE, outline = FALSE, col = c(6, 5, 7), las = 2)
boxplot(Petal.Width ~ Species, data = iris, at = 10:12, add = TRUE, outline = FALSE, col = c(6, 5, 7), las = 2)
# add points
stripchart(Sepal.Length ~ Species, vertical = TRUE, data = iris, method = "jitter", add = TRUE, pch = c(1, 2, 3), at = 1:3)
stripchart(Sepal.Width ~ Species, vertical = TRUE, data = iris, method = "jitter", add = TRUE, pch = c(1, 2, 3), at = 4:6)
stripchart(Petal.Length ~ Species, vertical = TRUE, data = iris, method = "jitter", add = TRUE, pch = c(1, 2, 3), at = 7:9)
stripchart(Petal.Width ~ Species, vertical = TRUE, data = iris, method = "jitter", add = TRUE, pch = c(1, 2, 3), at = 10:12)
# add text
text(2, 9.5, labels = "Sepal.Length")
text(5, 9.5, labels = "Sepal.Width")
text(8, 9.5, labels = "Petal.Length")
text(11, 9.5, labels = "Petal.Width")
text(2, 8.75, labels = "________")
text(5, 8.75, labels = "________")
text(8, 8.75, labels = "________")
text(11, 8.75, labels = "________")