
HomeworkHelpOnline.net Blog
We have accumulated huge amount of experience and we are sharing it with you in the form of tutorials for your best learning experience.

Download any Book, Textbook, or Scientific Article for Free
These pages are safe to use and can save you a lot of money and time in your pursuit of a university degree.
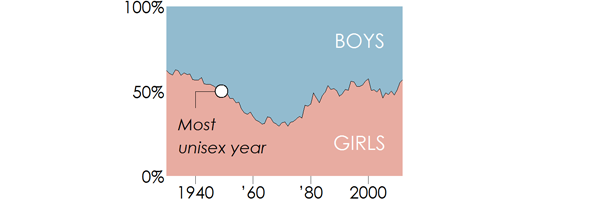
Top Unisex Baby Names of Last Century: R Studio Visualization
In this post, we combine data-wrangling and visualization skills to create a professional-looking data visualization using the ggplot2 package in R. Most popular unisex baby names are presented nicely in an R graph.
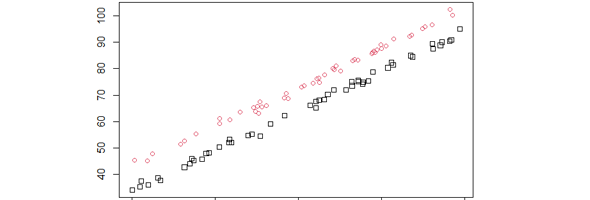
ANCOVA and Linear Models: Solution with Interpretation
Use ANCOVA and Linear models to solve example assignment.
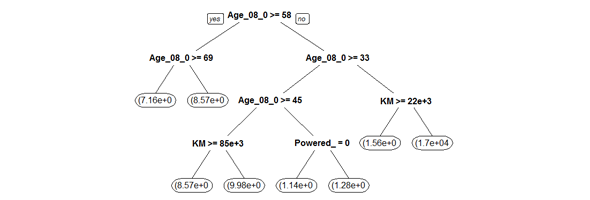
Model Prices Using Classificaton Trees and Regression in R
Use R Studio to create decision trees with pruning for building model to predict used car prices.
ANOVA, Linear and Logistic Regression, Chi-Square Test
Six problems exploring ANOVA, Linear and Logistic Regression, Chi-Square Test. And corresponding solutions in R Studio by our experts.
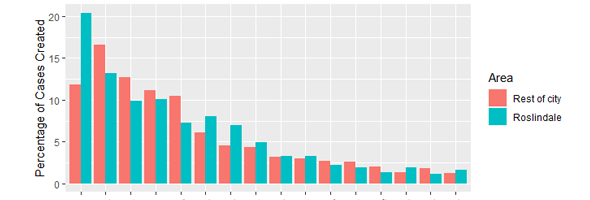
Dataset "311 Service Requests" Analysis Using tidyverse R Library
It is a popular dataset used to analyze service requests of various cities (Pitsburg, New York, etc.). This time we analyze Roslindale city in R.
Compare R Studio ggplot2 Graphs: qplot() vs ggplot()
R Studio ggplot2 library contains functions qplot() and ggplot(). What is the result of these functions? Example solution explains the differences.
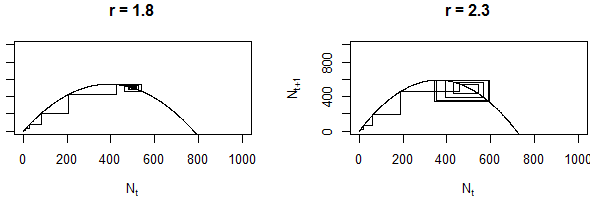
Discrete Logistic Model: Maps, Bifurcations, Oscillations, Convergence
Use R studio to analyze a logistic model - bottom up loop development and analysis.
Beginner Friendly Introduction to Statistics in R Programming
Example of beginner level university level assignment of R Studio statistics with solution.
Linear Regression in Matrix Form - R Studio
The following exercises aim to compare simple linear regression results computed in matrix form with the built in R function lm().
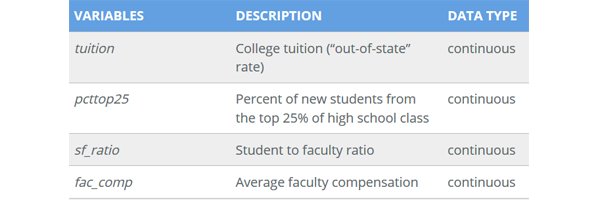
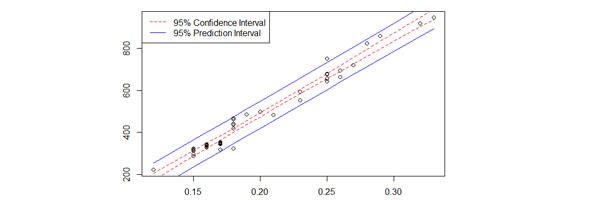
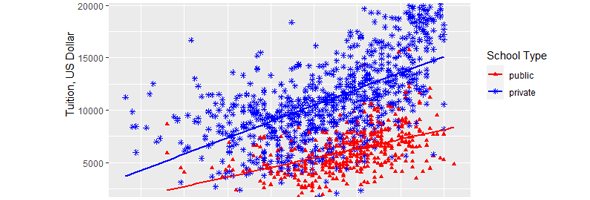
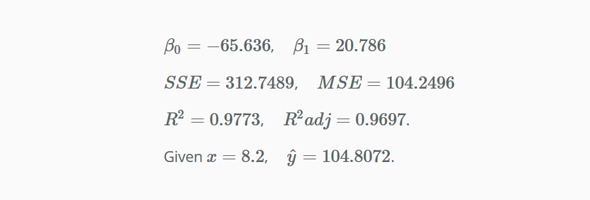
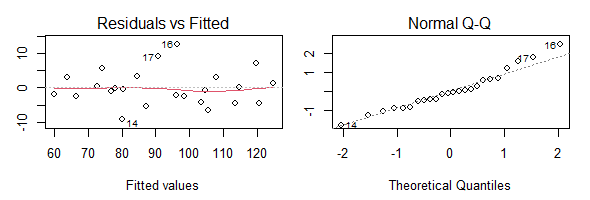
Linear Regression Analysis of College Tuition in R
The following exercises aim to use linear regression tools in R to investigate whether a linear relationship exists between tuition and other variables.
Multiple Linear Regression Exercises and Solutions
Solutions to Multiple Linear Regression Exercises in R Studio