
Tutorial: Finding Rectangles with NO OpenCV
Task: For any given image write a program to find all rectangular objects which are darker than the background. Draw the located rectangles on the output image.
Method: Linear Hough transform with advanced filtering
Restrictions: Solid colour rectangles only, Many wide-bordered rectangles slow down the program
Tutorial type: Algorithm oriented, written in Python
Requirements: Python 2.7, Numpy 1.9.2, Matplotlib 1.4.3, OpenCV 2.3 (used for Canny only!)
Intro
The tutorial code is written in Python, but it's well readable and can be implemented in Matlab, R, JAVA or any other programming language. In order to understand the subject more all the functions are built bottom-up with no outside resources used. Some examples of how the program performs are presented below:


To find partly not visible rectangles there is possibility to slightly modify the code.
Prepare Image
First we open an image, convert it to grayscale, blur and find edges. This is the only place where we will be using OpenCV. Image blurring and finding edges are crucial to the success of finding rectangles.
1 2 3 4 5 6 7 8 9 10 11 12 13 14 15 16 17 18 19 20 21 22 23 24 25 26 27 28 29 30 | import matplotlib.pyplot as plt #Used for plotting import matplotlib.image as mpimg #Used for image read import cv2 #Used for Canny only! import numpy as np #Basic calculations library import customFunctions #We will define some functions ourselves image_rgb = mpimg.imread('rectangles/rectangles.jpg') #Reading image to array image_gray = customFunctions.rgb2gray(image_rgb) #Converting rgb to gray image_gray = customFunctions.blurImage(image_gray) #Blurring gray image with custom function similar to OpenCV.filter2d #find it in paragraph Other Custom Functions Used edged = cv2.Canny(image_gray, 30, 130) #Finding edges, This is the only place we use OpenCV #Sometimes images have unnecessary lines at the edges and we don't whant to find them ##Zero out the border 5px borderLen = 5 #The width to zero out the borders, counted in pixels lenx, leny = edged.shape edged[0:borderLen,0:leny] = 0 edged[lenx-borderLen:lenx,0:leny] = 0 edged[0:lenx,0:borderLen] = 0 edged[0:lenx,leny-borderLen:leny] = 0 plt.imshow(edged) #Take a look at the edged picture ##Save edged picture to jpg fig, ax1 = plt.subplots(ncols=1, nrows=1, figsize=(8, 4)) ax1.set_axis_off() ax1.imshow(edged, cmap="bone") fig.savefig("Rectangles_edged.jpg") |
Here is the saved output files for both original and edged versions.


Hough Transform and Clustering
Hough Transform
For Hough transformation we will define our own function:
1 2 3 4 5 6 | rho,theta = customFunctions.houghLines(edged, rho_res=1, theta_res=1, thresholdVotes=30, filterMultiple=5, thresholdPixels=0) |
The full function looks like this:
1 2 3 4 5 6 7 8 9 10 11 12 13 14 15 16 17 18 19 20 21 22 23 24 25 26 27 28 29 30 31 32 33 34 35 36 37 38 39 40 41 42 43 44 45 46 47 48 49 50 51 52 53 54 55 56 57 58 59 60 61 62 63 | def houghLines(edged,rho_res,theta_res,thresholdVotes,filterMultiple,thresholdPixels=0): rows, columns = edged.shape theta = np.linspace(-90.0, 0.0, np.ceil(90.0/theta_res) + 1.0) theta = np.concatenate((theta, -theta[len(theta)-2::-1])) #defining empty Matrix in Hough space, where x is for theta and y is x*cos(theta)+y*sin(theta) diagonal = np.sqrt((rows - 1)**2 + (columns - 1)**2) q = np.ceil(diagonal/rho_res) nrho = 2*q + 1 rho = np.linspace(-q*rho_res, q*rho_res, nrho) houghMatrix = np.zeros((len(rho), len(theta))) #Here we populate houghMatrix for rowId in range(rows): #for each x in edged for colId in range(columns): #for each y in edged if edged[rowId, colId]>thresholdPixels: #edged has values 0 or 255 in our case #for each theta we calculate rhoVal, then locate it in Hough space plane for thId in range(len(theta)): rhoVal = colId*np.cos(theta[thId]*np.pi/180.0) + \ rowId*np.sin(theta[thId]*np.pi/180) rhoIdx = np.nonzero(np.abs(rho-rhoVal) == np.min(np.abs(rho-rhoVal)))[0] houghMatrix[rhoIdx[0], thId] += 1 #cluster and filter multiple dots in Houghs plane if filterMultiple>0: clusterDiameter=filterMultiple values=np.transpose(np.array(np.nonzero(houghMatrix>thresholdVotes))) filterArray=[] filterArray.append(0) totalArray=[] for i in range (0, len(values)): if i in filterArray[1::]: continue tempArray=[i] for j in range (i+1, len(values)): if j in filterArray[1::]: continue for k in range (0, len(tempArray)): if getLength(values[tempArray[k]],values[j])<clusterDiameter: filterArray.append(j) tempArray.append(j) break totalArray.append(tempArray) #leave the highest value in each cluster for i in range (0, len(totalArray)): for j in range (0, len(totalArray[i])): if j==0: highest=houghMatrix[values[totalArray[i][j]][0],values[totalArray[i][j]][1]] ii=i jj=j else: if houghMatrix[values[totalArray[i][j]][0],values[totalArray[i][j]][1]]>=highest: highest=houghMatrix[values[totalArray[i][j]][0],values[totalArray[i][j]][1]] houghMatrix[values[totalArray[ii][jj]][0],values[totalArray[ii][jj]][1]]=0 ii=i jj=j else: houghMatrix[values[totalArray[i][j]][0],values[totalArray[i][j]][1]]=0 return (np.where(houghMatrix>thresholdVotes)[0]-q)*rho_res, theta[np.where(houghMatrix>thresholdVotes)[1]]*np.pi/180.0 |
Some questions that may arise from the code:
Why Hough matrix has such dimensions? Dimension 1 ranges are defined by maximum value for sin(x)+cos(x) which is sqrt(2). So it's maximum is (numColumnsImage+numRowsImage)*sqrt(2). Dimension 2 is theta which ranges from -90 to 90 in degrees. Every dimension has it's resolution which is taken as parameter to the function, which divides the number of points we will count.
Why we use thresholdPixels? We want to consider only points that are edges and in some cases edged image may be not boolean and we want to filter it by threshold.
Why we use filtering? Well, it's unnecessary, but it speeds up the program significantly. On the other hand it sometimes might produce wrong results, for example when we have multiple rectangles in the image, where their contour lines are very nearby in Hough space (same angle, or nearby r value [r=x*cos(th)+y*sin(th)]).
Next chapter will describe filtering in details.
Clustering and Filtering
We have 7 real lines in our image. We may choose appropriate thresholdVotes parameter to filter out unnecessary points in Hough plane, but usually the process is automatic and the program does not know the correct thresholdVotes value. For this reason we got 1060 of points after Hough transform and only 26 points after using clustering and filtering. So we have 19 false-positives for now. Points higher than thresholdVotes in Hough plane before and after filtering look like that:


The results on the image looks like this - found lines before and after filtering:


For easy plotting found lines in Hough space knowing rho and theta we define our own function plotHoughLines:
1 2 3 4 5 6 7 8 9 10 11 12 13 14 15 16 17 18 19 | def plotHoughLines(rho,theta,image): a = np.cos(theta) b = np.sin(theta) x0 = a*rho y0 = b*rho fig2, ax1 = plt.subplots(ncols=1, nrows=1) ax1.imshow(image) for i in range (0, len(rho)): ax1.plot( [x0[i] + 1000*(-b[i]), x0[i] - 1000*(-b[i])], [y0[i] + 1000*(a[i]), y0[i] - 1000*(a[i])], 'xb-',linewidth=3) ax1.set_ylim([image.shape[0],0]) ax1.set_xlim([0,image.shape[1]]) plt.show() |
Find Corners from Hough Lines
Continue the main program using found rho and theta for every found line. Next steps are to find all parallel lines, to pair them, find perpendicular pairs, and solve linear equations to find corners at each intersection.
1 2 3 4 5 6 7 8 9 10 11 12 13 14 15 16 17 18 19 20 21 22 23 24 25 26 27 28 29 30 31 32 33 34 35 36 37 38 39 40 41 42 43 44 45 46 47 48 49 50 51 52 53 54 55 56 57 58 | ##Parameters for finding parallel lines theta2=theta+np.pi/2 theta3=theta-np.pi/2 difference=np.pi/90 differenceRho=2 #find parallel pairs accumParallel=[] for i in range (0, len(theta)): for j in range (i+1, len(theta)): if theta[j]>(theta[i]-difference) and theta[j]<(theta[i]+difference): if rho[j]<(rho[i]-differenceRho) or rho[j]>(rho[i]+differenceRho): accumParallel.append([i,j]) fourLines=[] #find perpendicular pairs for parallel pairs for i in range (0, len(accumParallel)): for j in range (1, len(accumParallel)): if (theta2[accumParallel[j][0]]>(theta[accumParallel[i][0]]-difference) and theta2[accumParallel[j][0]]<(theta[accumParallel[i][0]]+difference)) \ or (theta2[accumParallel[j][1]]>(theta[accumParallel[i][0]]-difference) and theta2[accumParallel[j][1]]<(theta[accumParallel[i][0]]+difference)) \ or (theta2[accumParallel[j][0]]>(theta[accumParallel[i][1]]-difference) and theta2[accumParallel[j][0]]<(theta[accumParallel[i][1]]+difference)) \ or (theta2[accumParallel[j][1]]>(theta[accumParallel[i][1]]-difference) and theta2[accumParallel[j][1]]<(theta[accumParallel[i][1]]+difference)) \ or (theta3[accumParallel[j][0]]>(theta[accumParallel[i][0]]-difference) and theta3[accumParallel[j][0]]<(theta[accumParallel[i][0]]+difference)) \ or (theta3[accumParallel[j][1]]>(theta[accumParallel[i][0]]-difference) and theta3[accumParallel[j][1]]<(theta[accumParallel[i][0]]+difference)) \ or (theta3[accumParallel[j][0]]>(theta[accumParallel[i][1]]-difference) and theta3[accumParallel[j][0]]<(theta[accumParallel[i][1]]+difference)) \ or (theta3[accumParallel[j][1]]>(theta[accumParallel[i][1]]-difference) and theta3[accumParallel[j][1]]<(theta[accumParallel[i][1]]+difference)): fourLines.append(np.concatenate([accumParallel[i],accumParallel[j]],1)) fourLines=customFunctions.unique(fourLines) #solve 4 of equations for 4 corners #rho_j = x cos(theta_j) + y sin(theta_j) #rho_k = x cos(theta_k) + y sin(theta_k) corners=[] for quads in range (0, len(fourLines)): cornersTemp=[] for lines in range (0,4): if lines in [0,1]: linesi=lines nexti=2 if lines == 2: linesi=0 nexti=3 if lines == 3: linesi=1 nexti=1 b=np.array([rho[fourLines[quads][linesi]],rho[fourLines[quads][linesi+nexti]]]) a=np.array([[np.cos(theta[fourLines[quads][linesi]]), np.sin(theta[fourLines[quads][linesi]])], [np.cos(theta[fourLines[quads][linesi+nexti]]), np.sin(theta[fourLines[quads][linesi+nexti]])]]) ans = np.linalg.solve(a, b) cornersTemp.append([int(ans[0]),int(ans[1])]) corners.append(cornersTemp) #reorder corners corners=customFunctions.reorderPoints(corners) |
Filter Wrong and Duplicate Rectangles
This part consists of four types of filtering to avoid false-positives. We will discuss each of them one by one.
Remove if small: This is the most simple check, where the rectangle is deleted if any of it's sides is shorter than specific value. In our case we choose it to be 20 pixels.
Remove if standard deviation inside rectangle is high: If standard deviation is high, that may mean that rectangles has ended somewhere inside area of our corners. But this check is the one which restricts the code work only with solid rectangles.
Remove if brighter: The requirement by task is fulfilled by checking the outer color of the rectangle. It is completed by selecting four points outside rectangle in the line from the midpoint to all for middles of sides.
Remove if many in same place: After all the filtering there still is a problem where many rectangles are correctly found, but the lines differs by few pixels. We run extra check to leave only rectangles best fitting the edged image.
1 2 3 4 5 6 7 8 9 10 11 12 13 14 15 16 17 18 19 20 21 22 23 24 25 26 27 28 29 30 31 32 33 34 35 36 37 38 39 40 41 42 43 44 45 46 47 48 49 50 51 52 53 54 55 56 57 58 59 60 61 62 63 64 65 66 67 68 69 70 71 72 73 74 75 76 77 78 79 80 81 82 83 84 85 86 87 88 89 90 91 92 93 94 | #check if valid rectangles for i in range (len(corners)-1,-1,-1): minx=np.min(np.array(corners[i])[:,0]) maxx=np.max(np.array(corners[i])[:,0]) miny=np.min(np.array(corners[i])[:,1]) maxy=np.max(np.array(corners[i])[:,1]) height=customFunctions.getLength(corners[i][0],corners[i][1]) width=customFunctions.getLength(corners[i][2],corners[i][1]) #remove wrongs if small if height<20 or width<20 or maxy-miny<10 or maxx-minx<10: del corners[i] continue xlin=np.array(np.linspace(corners[i][0][0],corners[i][2][0],20)).astype(int) ylin=np.array(np.linspace(corners[i][0][1],corners[i][2][1],20)).astype(int) xlin2=np.array(np.linspace(corners[i][1][0],corners[i][3][0],20)).astype(int) ylin2=np.array(np.linspace(corners[i][1][1],corners[i][3][1],20)).astype(int) #remove wrong rectangle if std std=np.std(np.concatenate([image_gray[(ylin[2:-2]),(xlin[2:-2])],image_gray[(ylin2[2:-2]),(xlin2[2:-2])]])) if std>7: del corners[i] continue #remove wrongs if brighter averageInside=np.average(np.concatenate([image_gray[(ylin[2:-2]),(xlin[2:-2])],image_gray[(ylin2[2:-2]),(xlin2[2:-2])]])) corners[i].append(corners[i][0]) delete=0 pixelsFromBorder=5 middlePoint=np.array([(corners[i][0][0]+corners[i][2][0])/2,(corners[i][0][1]+corners[i][2][1])/2]) for j in range (0,4): y=pixelsFromBorder*np.sin(customFunctions.getAngle([0,0],[1,0],(np.array(corners[i][j+1])+np.array(corners[i][j]))/2-middlePoint,False)) x=pixelsFromBorder*np.cos(customFunctions.getAngle([0,0],[1,0.01],(np.array(corners[i][j+1])+np.array(corners[i][j]))/2-middlePoint,False)) a=(np.array(corners[i][j+1])+np.array(corners[i][j]))/2+[int(x),int(y)] if image_gray[a[1],a[0]]-averageInside<5: delete=1 if delete==1: del corners[i] continue # #Removing duplicates #Here we remove duplicate rectangles by finding the overlapping ones sumi=np.zeros(len(corners)) middlePoint=np.zeros((len(corners),2)) for i in range (len(corners)-1,-1,-1): middlePoint[i]=np.array([(corners[i][0][0]+corners[i][2][0])/2,(corners[i][0][1]+corners[i][2][1])/2]) #check for edges for j in range (0,4): x1=corners[i][j][0] x2=corners[i][j+1][0] y1=corners[i][j][1] y2=corners[i][j+1][1] if x1!=x2: m = (y2-y1)/(1.0*(x2-x1)) q = y2-m*x2 x = np.linspace(np.min([x1,x2]),np.min([np.max([x1,x2]),edged.shape[1]-5]),np.absolute(x2-x1)+1) y = m*x+q else: y = np.linspace(np.min([y1,y2]),np.min([np.max([y1,y2]),edged.shape[1]-5]),np.max([y1,y2])-np.min([y1,y2])+1) x = x1*np.ones(len(y)) sumi[i] += np.sum(edged[np.round(y).astype(int),np.round(x).astype(int)])/255.0 maxDistance=10 corners2=[] corners2.append(len(corners)-1) for i in range (len(corners)-2,-1,-1): found=0 for j in range (len(corners2)-1,-1,-1): if customFunctions.getLength(middlePoint[corners2[j]],middlePoint[i])<=maxDistance: found=1 if sumi[i]>sumi[corners2[j]]: corners2[j]=i if found==0: corners2.append(i) fig2, ax1 = plt.subplots(ncols=1, nrows=1, figsize=(8, 4)) ax1.imshow(image_rgb) ax1.set_axis_off() for i in corners2: corners[i].append(corners[i][0]) for j in range (0,4): ax1.plot( [corners[i][j][0],corners[i][j+1][0]],[corners[i][j][1],corners[i][j+1][1]], 'xb-',linewidth=3) ax1.set_ylim([image_gray.shape[0],0]) ax1.set_xlim([0,image_gray.shape[1]]) fig2.savefig("Example4.jpg") if len(corners)>0: plt.show() else: print ('No rectangles were found') |
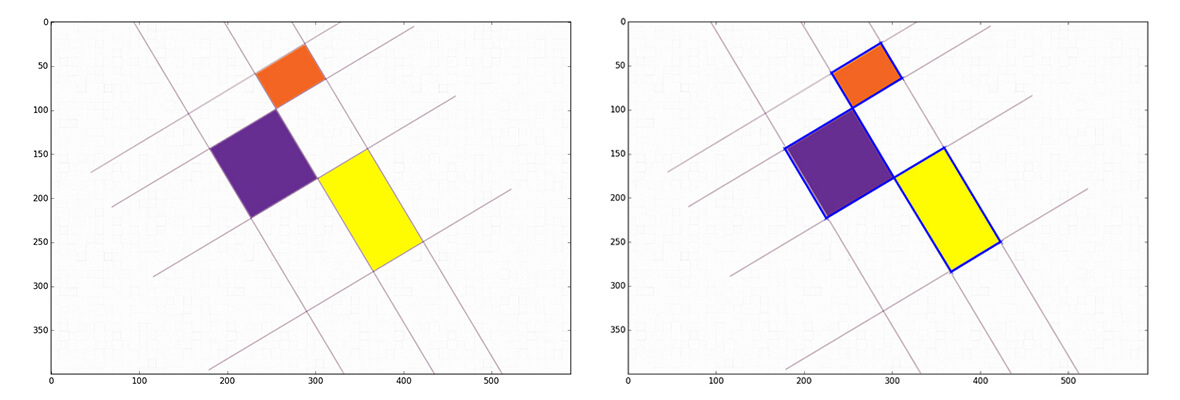
Here is the final result:

Other Custom Functions Used
Here we define some other custom function that we used in the tutorial.
Length between two points (given coordinates) in Cartesian plane
1 2 3 4 5 6 7 8 9 10 11 12 | def getLength(startPoint,secondPoint): ##Inputs: #startPoint - [x,y] #secondPoint - [x,y] ##Outputs: #lenv - length between two points v1x=secondPoint[0]-startPoint[0] v1y=secondPoint[1]-startPoint[1] lenv=np.sqrt(v1x*v1x+v1y*v1y) return lenv |
Find all unique rows in a list by first reordering each row ascending
1 2 3 4 5 6 7 8 9 10 11 12 13 14 15 16 17 18 19 20 21 22 23 24 | def unique(a): ##Inputs: #a - list of 1xN arrays ##Outputs: #b - filtered array #Example # a=[array([ 1, 3, 12, 17]), # array([ 1, 3, 17, 12]), # array([ 1, 3, 18, 20])] # b -> [array([ 1, 3, 12, 17]), # array([ 1, 3, 18, 20])] b=np.array(a) a=np.sort(np.array(a)) order = np.lexsort(a.T) a = a[order] b = b[order] diff = np.diff(a, axis=0) ui = np.ones(len(a), 'bool') ui[1:] = (diff != 0).any(axis=1) return b[ui] |
Reorder corners of quadrangle in such a way that nearby corners follows each other
1 2 3 4 5 6 7 8 9 10 11 12 13 14 15 16 17 18 19 20 21 22 23 24 25 | def reorderPoints(corners): ##Inputs: #corners - list of corners (look at example) ##Outputs: #array - reordered corners array #Example #corenrs=[[153, 104], [255, 98], [178, 144], [231, 58]] #array -> [[153, 104], [178, 144], [255, 98], [231, 58]] array=[] for i in range (0, len(corners)): tempArray=[] length1=getLength(corners[i][0],corners[i][1]) length2=getLength(corners[i][0],corners[i][2]) length3=getLength(corners[i][0],corners[i][3]) lenArr=np.array([length1,length2,length3]) tempArray.append(corners[i][0]) tempArray.append(corners[i][1+np.where(np.array(lenArr)==np.min(lenArr))[0][0]]) lenArr[np.where(np.array(lenArr)==np.min(lenArr))[0][0]]+=-0.00001 #in case of square tempArray.append(corners[i][1+np.where(np.array(lenArr)==np.max(lenArr))[0][0]]) tempArray.append(corners[i][1+np.where(np.array(lenArr)==np.median(lenArr))[0][0]]) array.append(tempArray) return array |
Get angle in radians between two vectors defined by points in coordinate system (absolute value or signed value)
1 2 3 4 5 6 7 8 9 10 11 12 13 14 15 16 17 18 19 20 21 22 23 24 25 26 27 28 29 30 | def getAngle(startPoint,secondPoint,thirdPoint, absol=True): #Gets angle between vectors (startPoint,secondPoint) and vector #(secondPoint,thirdPoint) ##Inputs: #startPoint - [x,y] #secondPoint - [x,y] #thirdPoint - [x,y] ##Outputs: #angle - angle between two vectors in radians v1x=secondPoint[0]-startPoint[0] v1y=secondPoint[1]-startPoint[1] v2x=thirdPoint[0]-startPoint[0] v2y=thirdPoint[1]-startPoint[1] lenv1=np.sqrt(v1x*v1x+v1y*v1y) lenv2=np.sqrt(v2x*v2x+v2y*v2y) angle=np.arccos((v1x*v2x+v1y*v2y)/(lenv1*lenv2)) a=1 if absol==False: a = np.sign((v1x) * (v2y) - (v1y) * (v2x)) if np.absolute(angle) < 0.02: angle=0 return a*angle |
Convert rgb image to grayscale
1 2 3 4 5 6 | def rgb2gray(image_rgb): r, g, b = image_rgb[:,:,0], image_rgb[:,:,1], image_rgb[:,:,2] image_gray = np.round(0.2989 * r + 0.5870 * g + 0.1140 * b).astype(np.uint8) return image_gray |
Blur image using flat 2x2 kernel (averaging)
1 2 3 4 5 6 7 8 9 | def blurImage(image_gray): kernel = np.ones((2,2),np.float32)/4 #Blurring kernel #We will skip first line and first column to keep it more simple, it's zeroed out anyway. #now for every pixel we change it with the average of 4 pixels(as the kernel): itself, pixel to left #pixel up, and pixel up-left. It drifts some edges one pixel to bottom-down, but it does not matter as #long as we use edged picture for the future work res=sp.convolve2d(image_gray,kernel,mode='same') return np.round(res).astype(np.uint8) |
Download the Code
The source code is available on GitHub.